Gaan ‘n 2e Covid-golf SA tref?
Gaan die tweede Covid-golf ons soos ‘n tsunami tref?
Gaan ’n tweede Covid-golf ons land tref?
Wanneer?
Wat kan ons verwag na aanleiding van die tweede golf wat nou in Europa en die res van wêreld gebeur?
Marí Hudson gesels met dr Piet Streicher, ’n lid van die span van Panda – Pandemic Data Analytics – om deur die ontleding van beskikbare data ’n idee te kry wat op ons wag.
BELANGRIKSTE AFLEIDINGS
- Lande wat die eerste Covid golf beleef het, ondervind slegs ‘n klein tweede golf, met sterftes slegs sowat een-tiende van die eerste golf.
- Lande waar die eerste golf baie gou gestuit is, kan ‘n sterker tweede golf ondervind indien hulle nie weer dieselfde inperkingsmaatreëls instel nie.
- Daar is geen nodigheid vir nuwe inperkingsmaatreëls of veldhospitale vir die tweede golf nie.
- Die siekte- en sterftesyfer onder kinders en jongmense is steeds uiters laag. Kinders en jongmense is inderwaarheid baie veilig.
- Slegs mense ouer as 70 en diegene met diabetes moet self so versigtig moontlik wees.
- Geen land – nie eens Brasilië of Swede of Amerika of enige ander land wat min of geen inperkingsmaatreëls ingestel het – se infeksiekurwe het ooit bo 2% van die bevolking beweeg voordat dit op homsels begin inplof nie.
- Die aantale positiewe mense tydens die eerste golf, was waarskynlik baie hoër as aangemeld, dus is dit meer getrou om die aantal mense in ICU-beddens en sterftes van die eerste golf met die tweede golf te vergelyk, en volgens dié vergelyking is die tweede golf minstens 10x swakker as die eerste golf in die lande wat wel tydens die eerste golf deurgeloop het.
- Suid-Afrika hoef volgens die data-analise nie nuwe inperkings in te stel in die tweede golf nie, ook nie veldhospitale in te rig nie, en behoort normaal aan te gaan met die lewe en ekonomie, buiten vir ouer mense wat steeds versigtig moet wees.
Interessante agtergrond inligting
PANDA publiseer grafieke wat gebruik kan word om die tweede golf in Europa te ontleed. Dit is op bladsy 12 en 16 opwww.pandata.org.za live feed. Beide die gevalle en die sterftes word op dieselfde grafiek gewys.
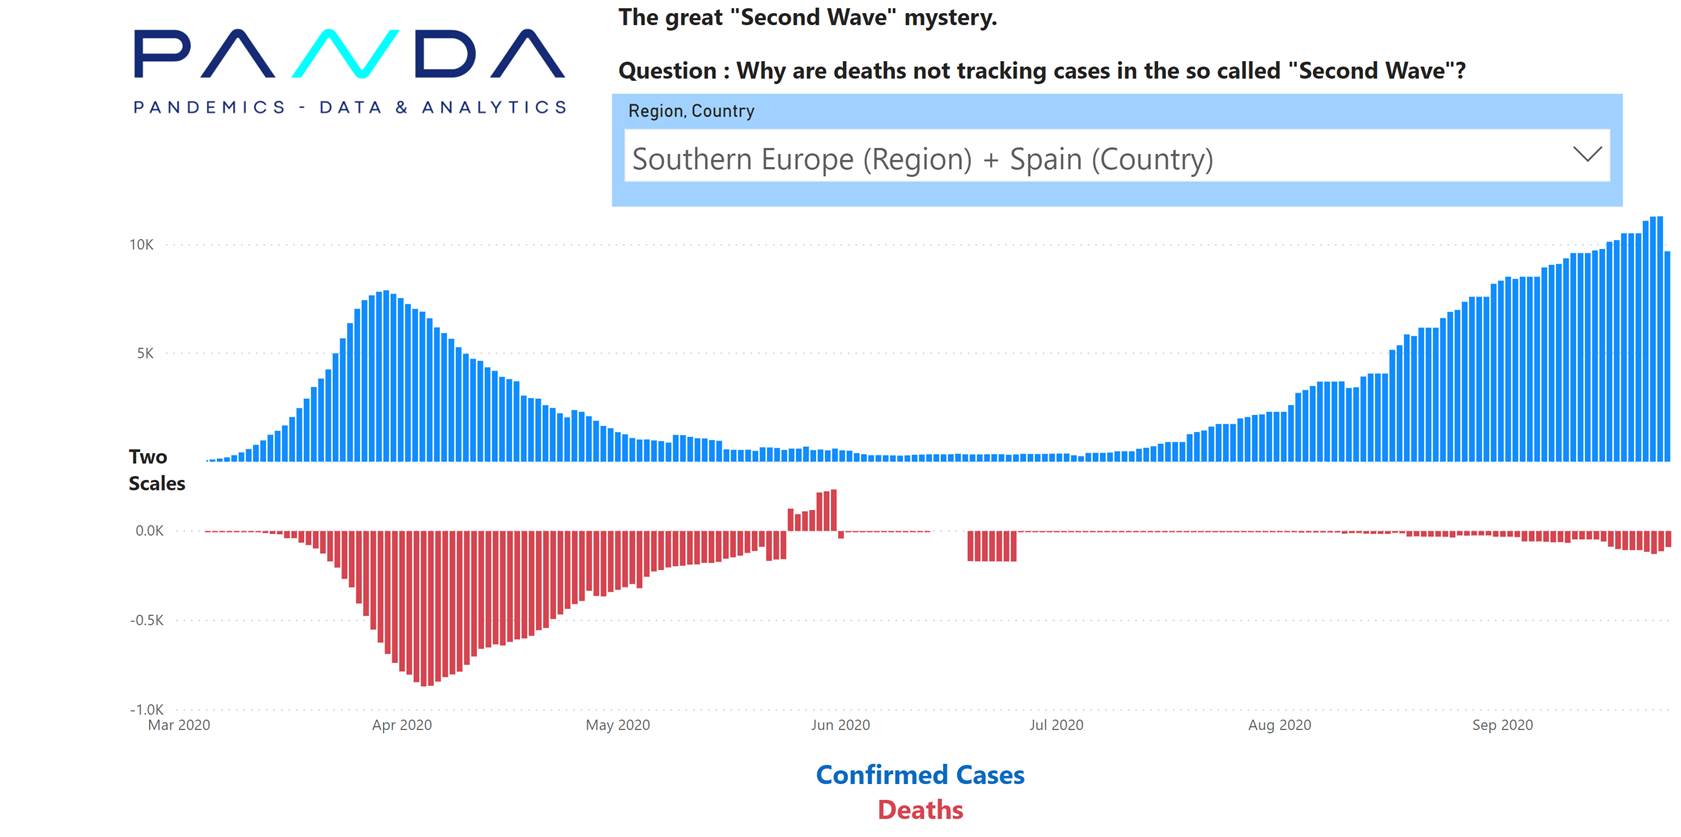
Lande met baie gevalle en baie sterftes met die eerste golf, het minder sterftes met die tweede golf.
Lande met baie gevalle en baie sterftes met die eerste golf, het minder sterftes met die tweede golf.
Een moontlike rede vir die lae CFR ( gevalle / sterfte verhouding ) is die verhoogte toets volumes. Tans word die bree publiek getoets insluitende mense met geen simptome. Met die eerste golf was slegs mense met simptome getoets. Met die eerste golf was daar min vals positiewe toetse, met die twee golf is daar meer. Met die eerste golf was die persentasie positiewe toetse (10%-20%) heelwat meer as die vals positiewe persentasie (1-3%).
Die grafiek hieronder wys hoe die aantal toetse toegeneem het (donker blou lyn):
Wes Europa:
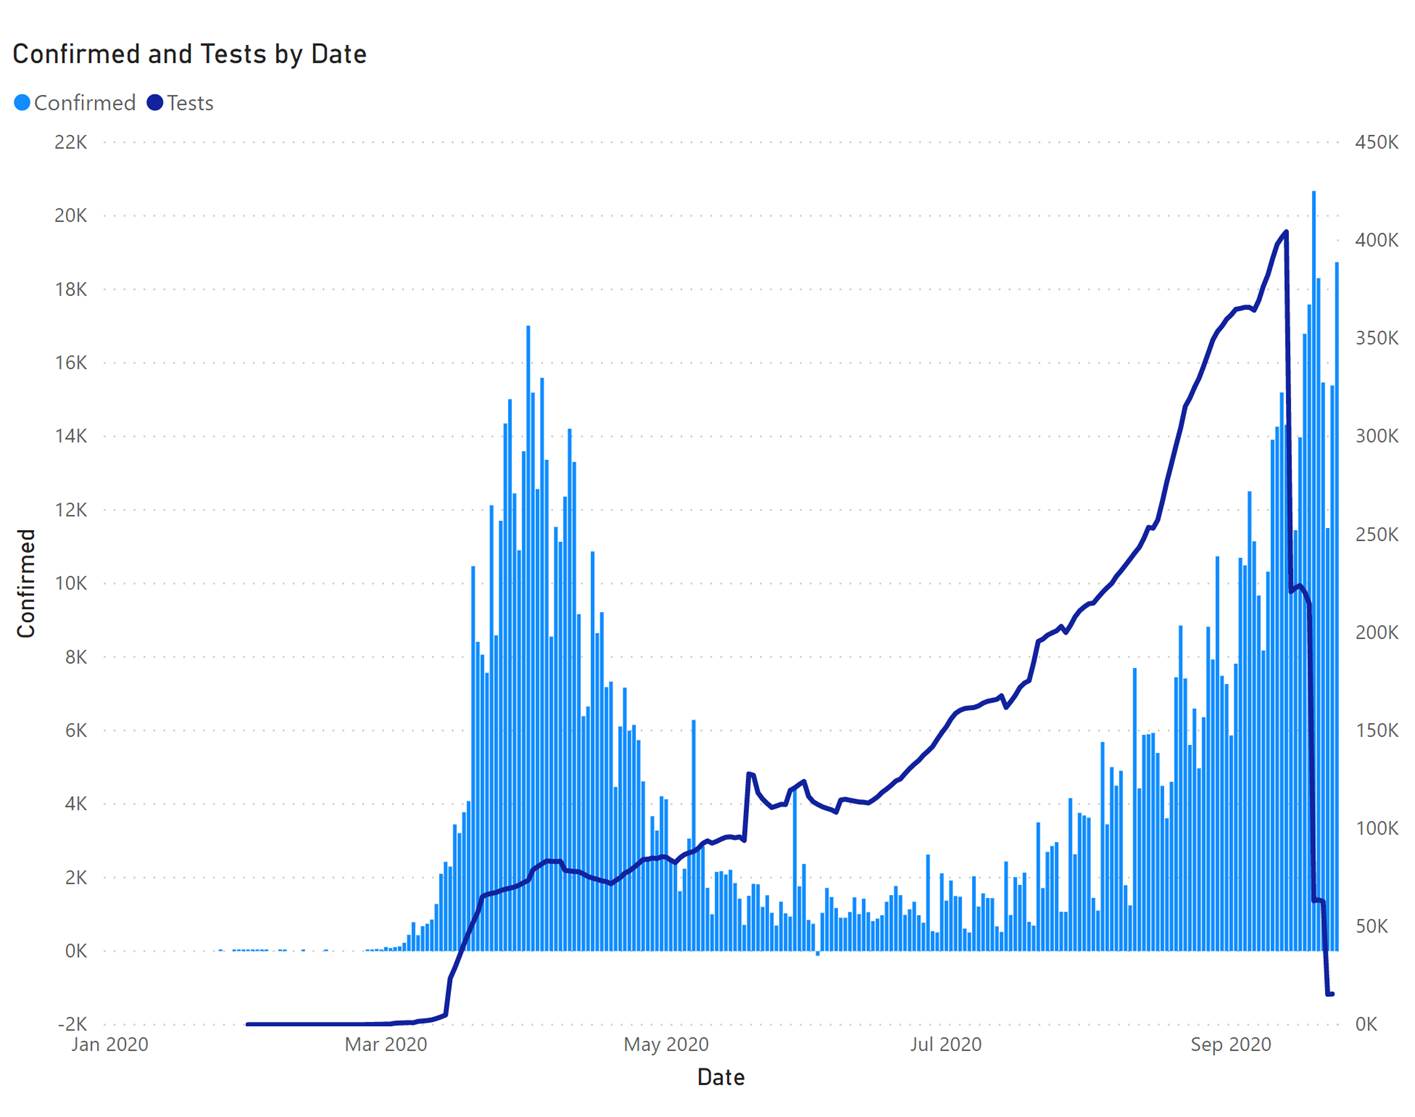
Die grafiek hierbo wys hoe die aantal toetse toegeneem het (donker blou lyn):
Indien ons 3% van die toets volumes van die gevalle aftrek, dan lyk die tweede golf heelwat kleiner:
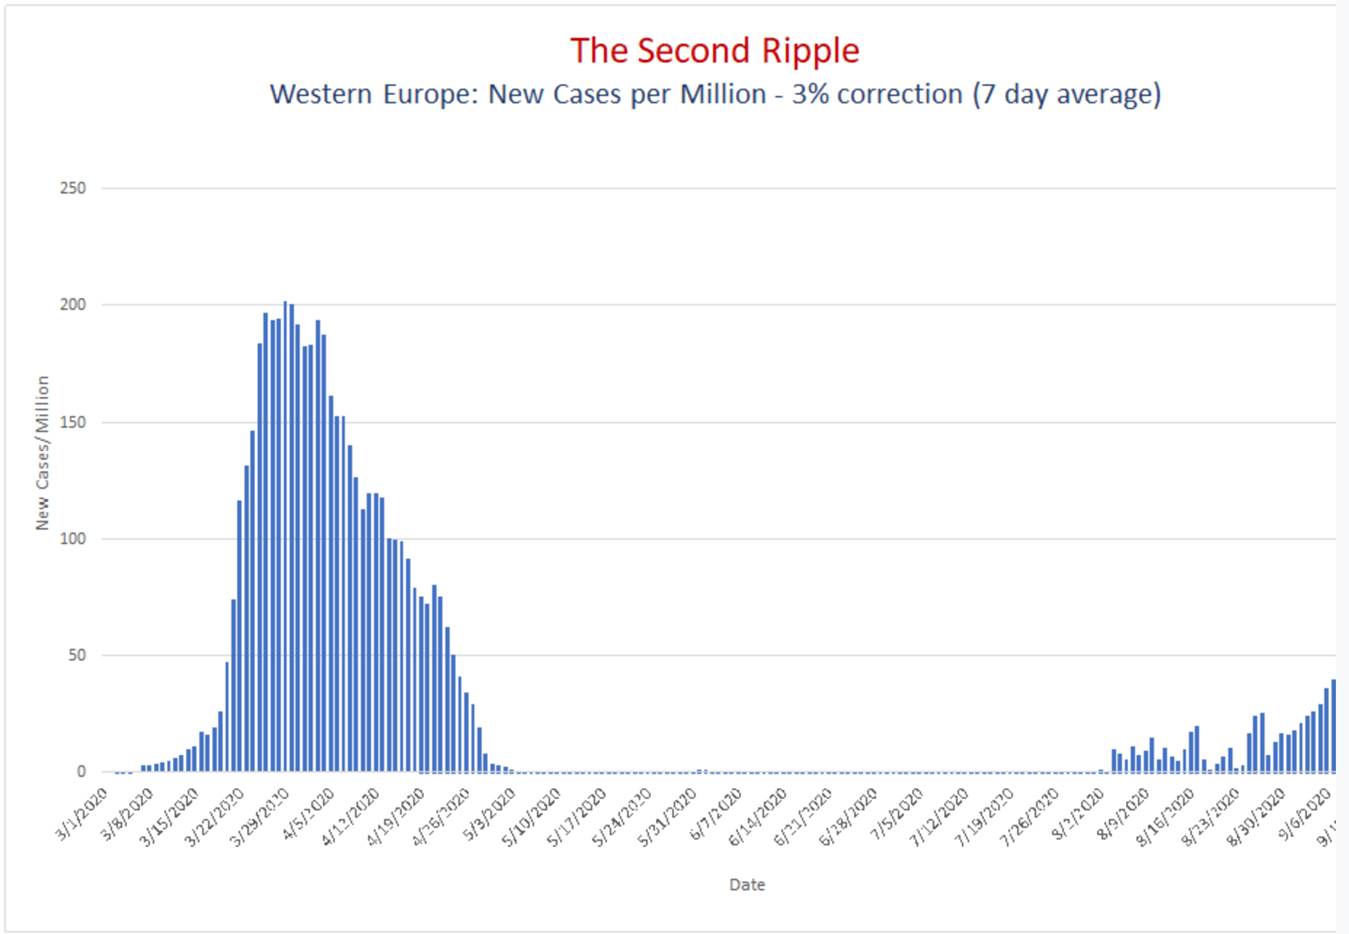
Ons moet ook in gedagte hou dat met die eerste golf slegs 1 uit 5 mense met ligte simptome getoets was. Dan was daar ook nog 5 keer meer mense wat asimptomaties was. Dit beteken dat daar 20-40 keer meer infeksies was as die aantal mense wat positief getoets was met die eerste golf. As ons al hierdie aspekte in gedagte hou is die aantal infeksies met die tweede golf wesenlik laer as met die eerste golf vir Wes Europa.
Die gevalle grafieke vir Europa skep dus ‘n wan-persepsie. Dit het groot nadelige gevolge. Byvoorbeeld, die NHS doen nog steeds slegs dringende operasies sodat hulle op gereedheidsgrondslag kan bly vir Covid pasiente. Dit beteken dat alle ander siektes afgeskeep word.
LEES OOK:
Western Cape Covid-19 fatalities now below 10 per day – South Africa will get there by mid-December
Introduction
Confirmed Covid-19 fatalities in the Western Cape have dropped below 10 per day on 20 September (measured as a 7 day average) as predicted by PANDA on CapeTalk on 31 July. Cumulative fatalities in the Western Cape tracked a Gompertz trajectory exactly since early April making accurate projections possible.
Accurate and timeous reporting of data facilitated this modelling. All the covariates such as confirmed cases, active cases, hospital and ICU beds were tracked, informing the projections originally made on 12 June.
Confirmed Covid-19 fatalities in South Africa will drop below 10 per day by mid-December.
Predictions made prior to joining PANDA
Estimates made by myself prior to joining PANDA and prior to using the Gompertz method were less accurate. Some of these are listed below.
- ● predicting 1,300 deaths for the WC on 31 May here.
- ● predicting 10,900 deaths for SA on 14 May h ere.Western Cape Gompertz projections made on 12 June
On 12 June Gompertz projections were published for the Western Cape here and a few days later were also published by Panda and released to the media here. Panda recommended the use of the Gompertz curve after observing that the death trajectories of multiple countries and regions followed a Gompertz trajectory.
More than 3 months later, these projections continue to perform well (see figure 1 and figure 2).
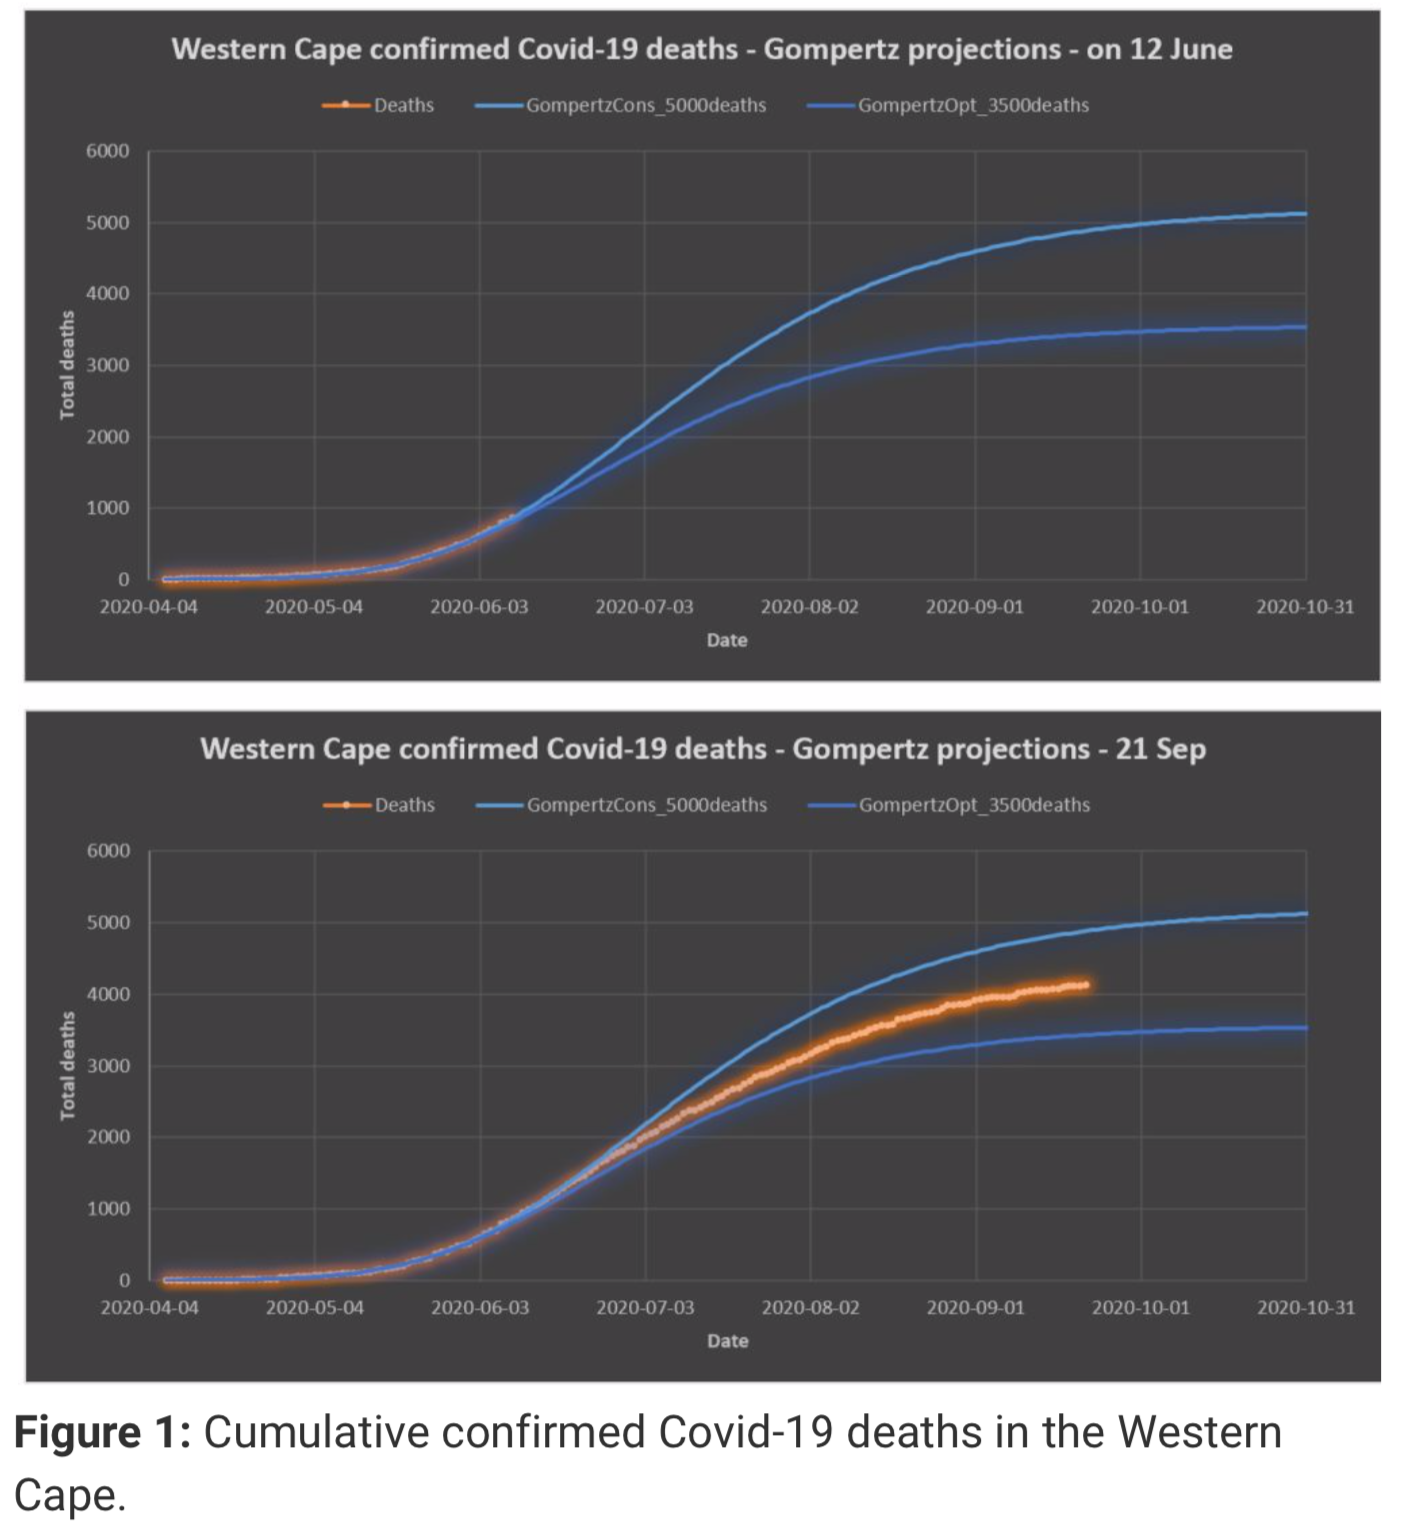
Figure 1: Cumulative confirmed Covid-19 deaths in the Western Cape.
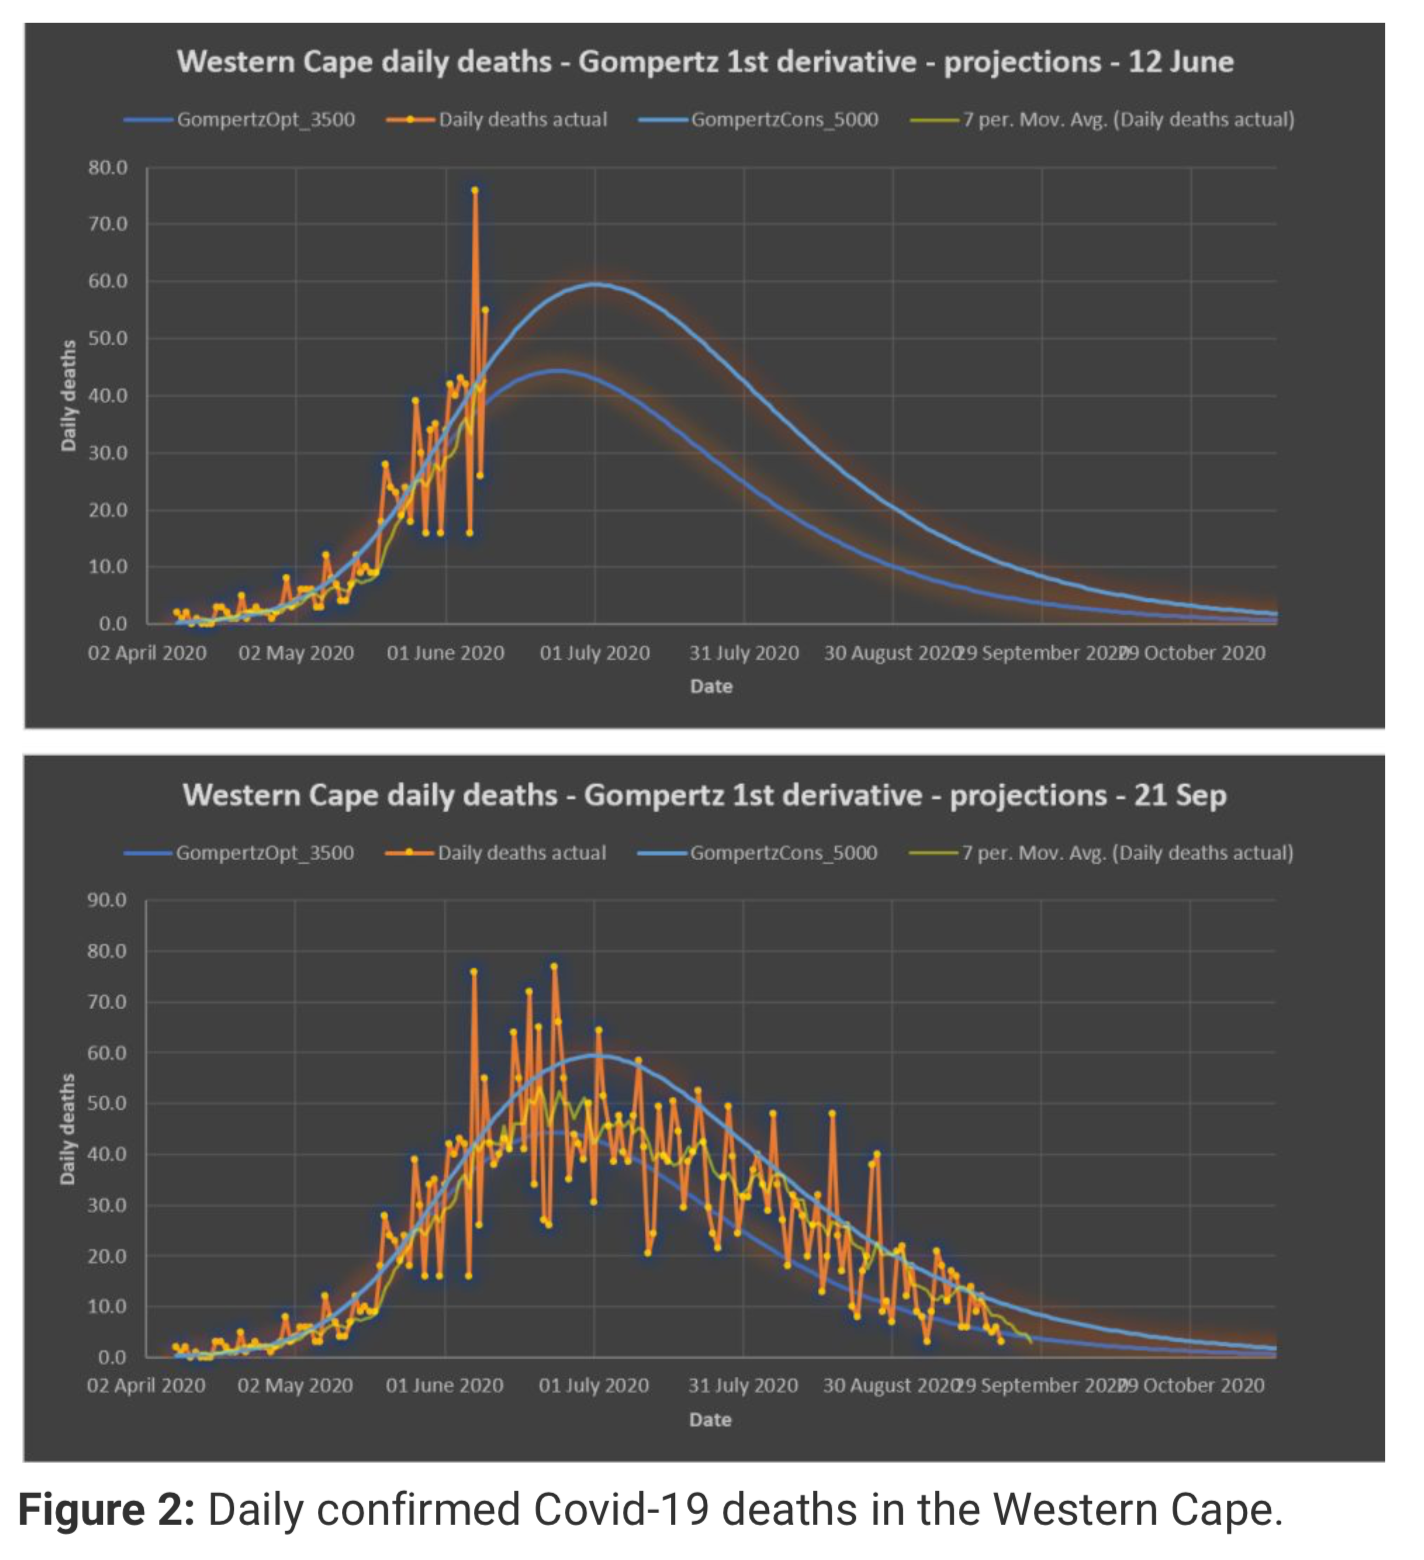
Figure 2: Daily confirmed Covid-19 deaths in the Western Cape.
Limitations of method
Fitting a curve to the confirmed Covid-19 deaths and projecting into the future will only predict confirmed Covid-19 deaths. If a significant portion of Covid-19 deaths are missed by authorities, this approach will not pick up such a discrepancy. The projections are only as good as the data used in making the projections.
Western Cape excess deaths
The MRC calculates excess deaths based on an expected number of deaths (using data from prior years) and subtracting this number from the actual deaths this year. This approach indicates the possibility of missing Covid-19 deaths, deaths caused by the lockdown measures itself or deaths caused by people not going to hospital when they should due to fear.
The Western Cape is the only province that hardly has any “excess” excess deaths. The excess deaths calculated from the historic trend by the MRC matches the confirmed Covid-19 deaths. As on 8 September the M RC reported 4,220 (table 2 in MRC report) excess deaths in the Western Cape.
Hospital and ICU bed estimates for the Western Cape
Peak active cases, hospital and ICU beds were estimated h ere for the Western Cape on 20 May resulting in an estimate of 20,000 confirmed active cases (the final number was 17,612 on 6/7) 1,429 hospital beds (the final number was 1,887 on 4/7) and 357 ICU beds (the final number was 357 on 23/7). By contrast, the forecasts reported by SACMC based on standard epidemiological SEIR models at the same time (19 May) were 3,000 to 6,000 ICU- (out by 8-17 times) and 8,500 to 17,500 hospital beds (out by 4-9 times).
The above predictions were based on the experience of the worst hit European countries and also on the relationships between the covariates (active cases/hospitalisations/icu) which remained relatively constant from the exponential phase to the peak phase. It did not involve the standard epidemiological SEIR model at all.
Timeline of SACMC fatality predictions for the Western Cape
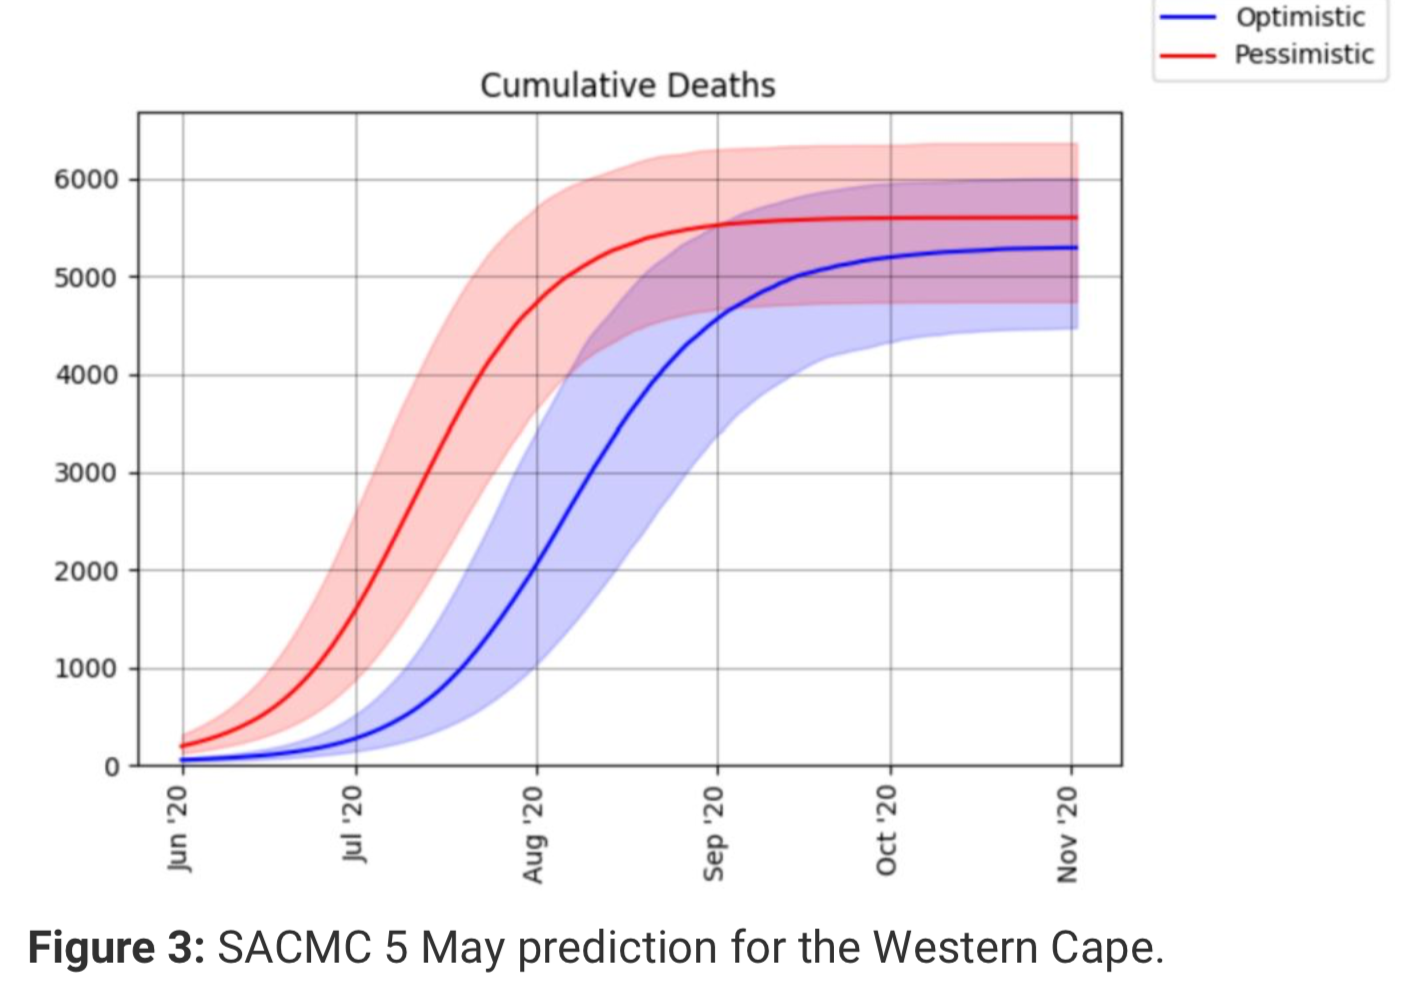
The SACMC predicted a total 4,473 to 6,365 fatalities for the Western Cape on 5 May (figure 3). This was a reasonable prediction considering that by 23 September the best estimate is around 4,400.
Figure 3: SACMC 5 May prediction for the Western Cape.
However, in their updated report published on 12 June, the death prediction was doubled. Figure 4 below gives an indication why.
Figure 4: SACMC – actual confirmed Covid-19 deaths diverging from 5 May prediction (published on 12 June).
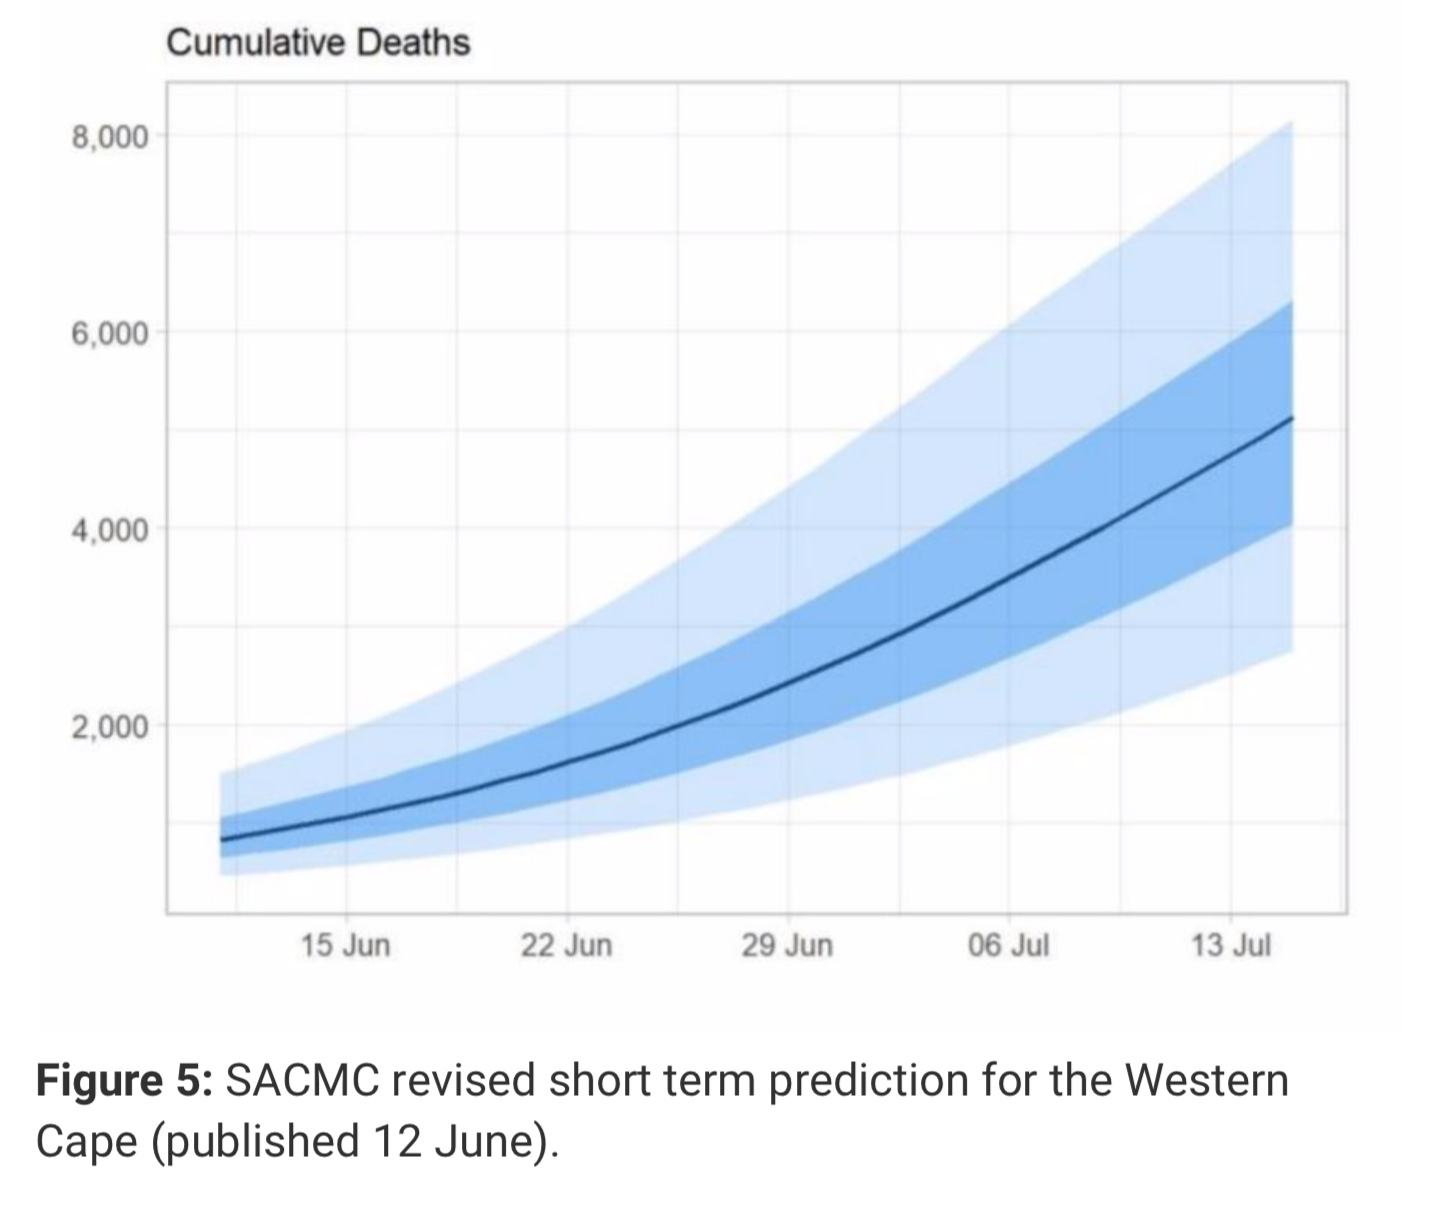
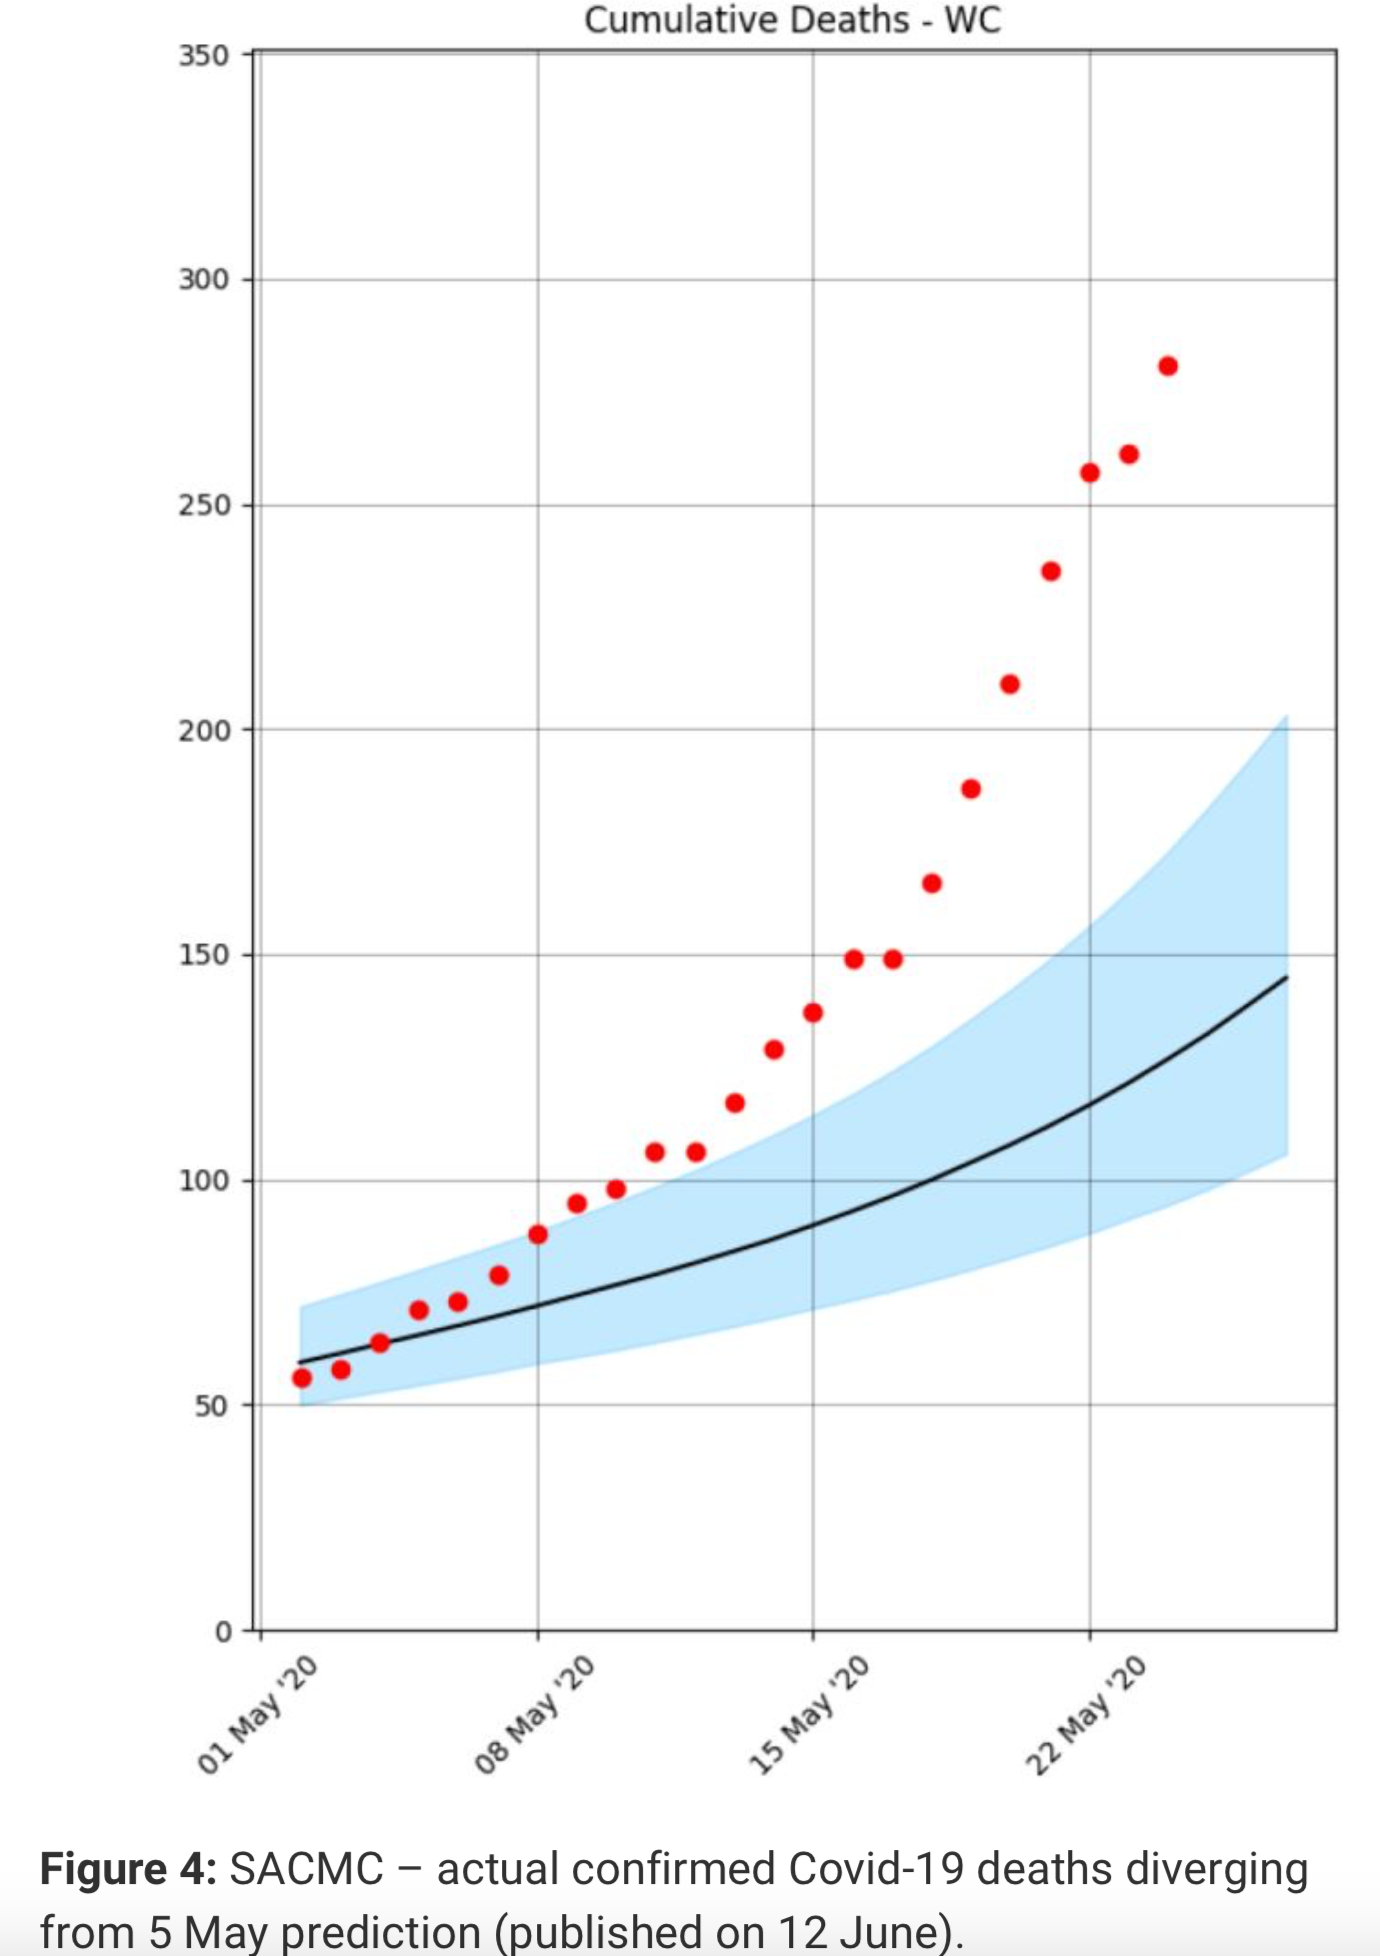 When actual confirmed Covid-19 deaths started tracking above their 5 May projection, they simply doubled the total deaths prediction even though by 12 June the Western Cape was only 12 days away from peak mortality rate. Their updated projection in contrast showed exponential growth continuing well into July (figure 5).
Figure 5: SACMC revised short term prediction for the Western Cape (published 12 June).
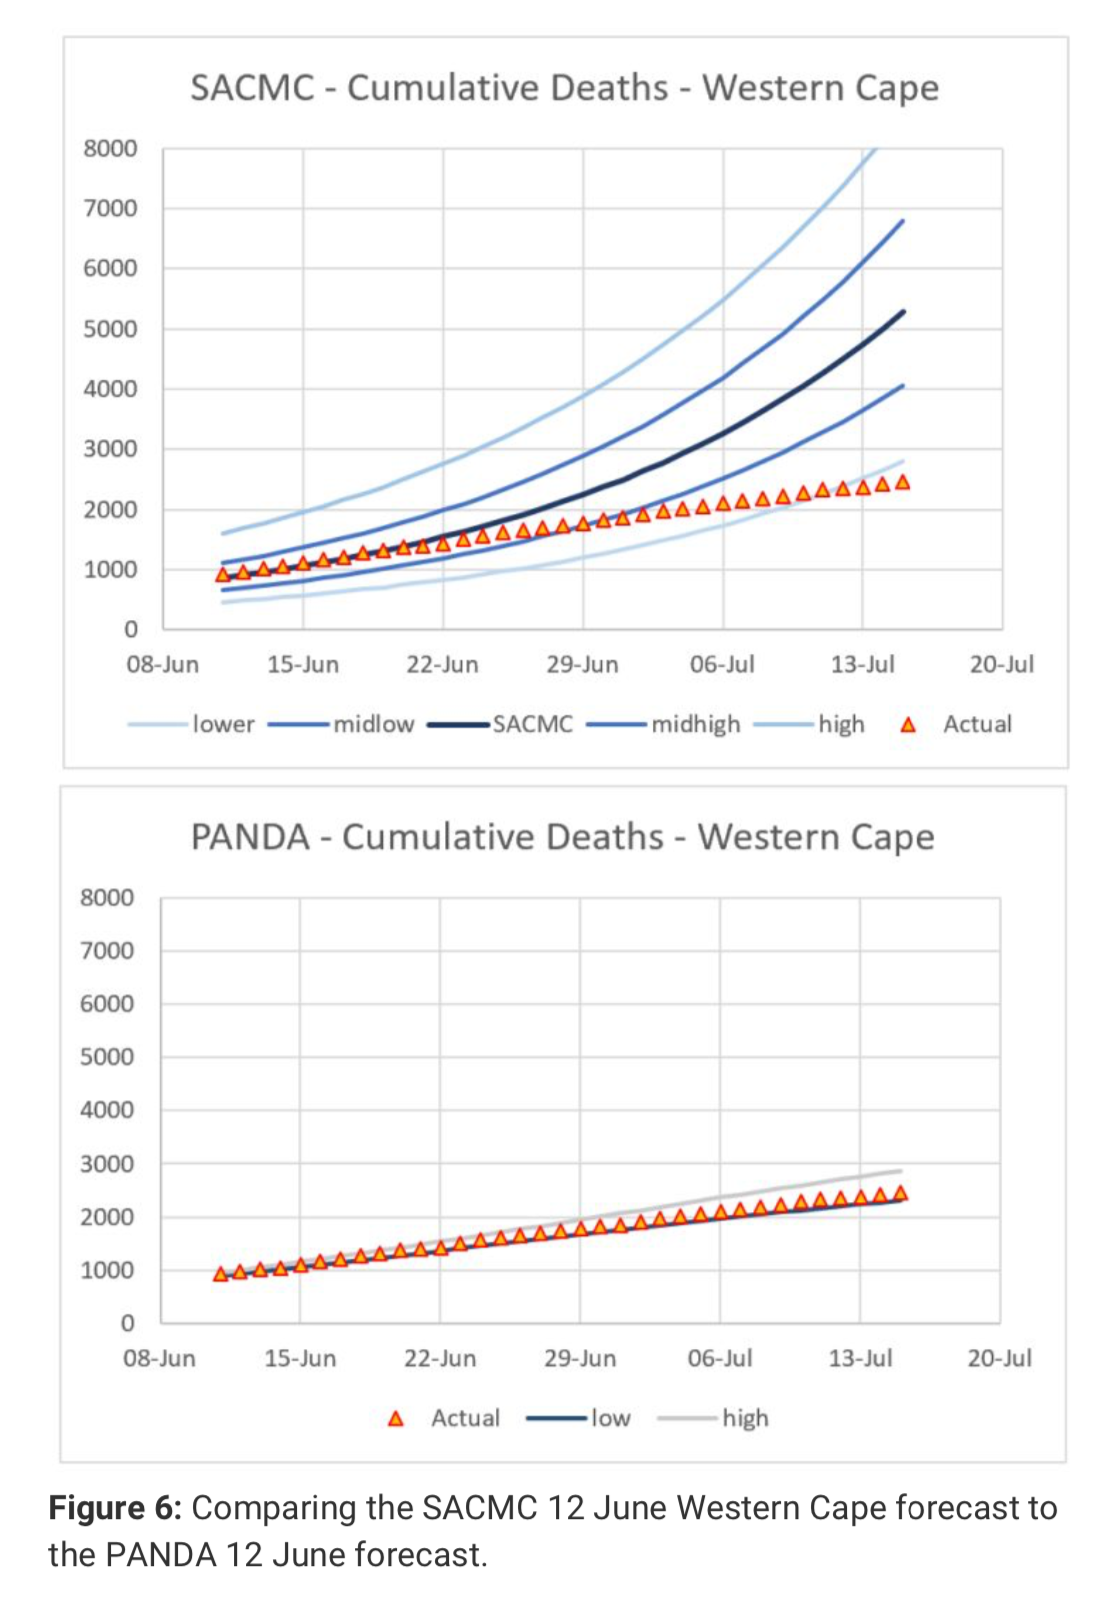
Within days it became apparent that the new SACMC Western Cape short term prediction was not doing well (figure 6). In contrast the PANDA projection with a much narrower envelope and published on the same day was spot on.
Figure 6: Comparing the SACMC 12 June Western Cape forecast to the PANDA 12 June forecast.
Cooperation from provincial and national bodies
The Western Cape Department of Health (WCDH) needs to be commended for the quality of the data presented to the general public on a daily basis on their Covid-19 dashboard. Since March various individuals at the WCDH answered more than 20 emails in a constructive way, clarifying data and providing additional information when required.
This is in stark contrast to some of the national bodies that at the worst ignored my emails and at best responded in a highly critical, condescending, sometimes threatening and often ridiculing tone.
Below find some quotes:
“There are serious issues with your methodology.”
“Please tread carefully. While your thesis may be proved right in the long-term the data at present do not support this. It would be seriously irresponsible to make claims of a declining epidemic in the WC on the basis of inappropriate analysis.”
“An appalling assumption!”
“Afraid, I’m stopping to communicate with you.”
“I see no reason to continue to correspond with you.”
“I’ll leave it up to other epidemiologists to point out the immodest, perhaps absurd, assumptions in your calculations. It would be a complete waste of my time.”
“Clarification – I’m not passing your model to anyone. Sure you can find your own epidemiologists to review.”
It briefly got better:
“Thank you for circulating the documents.”
alas not much:
“Even a basic understanding of distributions makes your error immediately apparent.”
Experts vs non-experts
Generally speaking people are well advised to listen to experts and professionals. Non-experts should not be afforded the same authority as professionals.
However, all interest groups must be listened to. Interest groups on all sides of the political spectrum have an incentive to closely scrutinise the work done by government appointed experts, and this scrutiny is absolutely necessary. When a collective top-down approach shows more promise it will be punted by the left (masks) and when a diverse bottom-up approach shows more promise (Sweden – herd immunity) it will be punted by the right. Often only time will tell which approach worked best.
It does not require an expert to notice that a prediction produced by an expert is wrong. When experts in a narrow academic field are floundering it helps to consult a much wider range of experts. A novel problem requires a much wider range of experts.
Different problem solving techniques develop within communities of different academic disciplines. PANDA realised this benefit since
inception and was soon joined by doctors, lawyers, actuaries, data scientists, economists and engineers. This interdisciplinary approach affords different perspectives which is crucial when dealing with novel problems.
Once accurate predictions are made on a consistent basis, the motives, methods, qualifications, training and expertise of those involved become less relevant. The proof is in the pudding.
South Africa will have less than 10 confirmed Covid-19 deaths a day by mid December
Figure 7: Daily confirmed Covid-19 fatalities for South Africa.
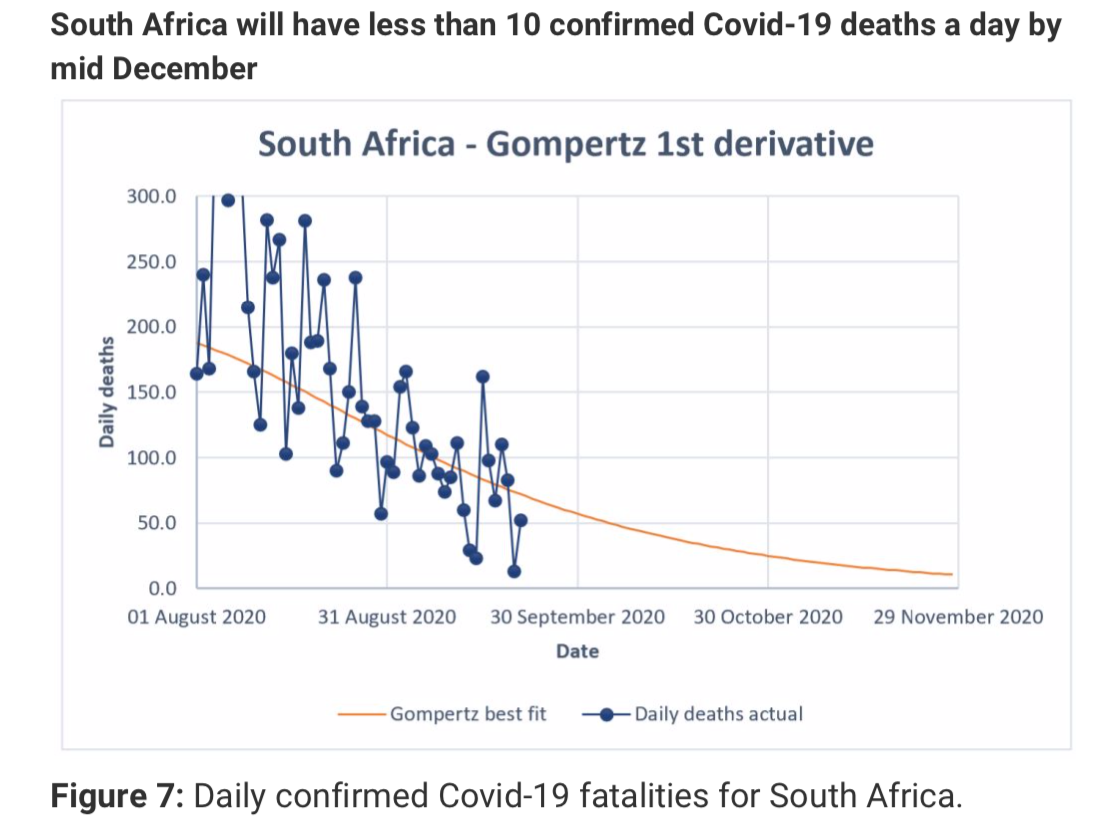
South Africa currently (21 Sep) has 79 confirmed Covid-19 fatalities per day on average (7d). This number is halving every 24 days (figure 7). By mid December the daily confirmed Covid-19 fatalities in SA will drop below 10 per day and it is likely to plateau at a total of 18,700 confirmed Covid-19 fatalities.
Conclusion
Confirmed Covid-19 fatalities in the Western Cape have dropped below 10 per day on 20 September. The death trajectory did not change despite the consistent lifting of lockdown measures from level 5 to 4 to 3 to 2 to 1, questioning the effectiveness of lockdown measures in making any change to the death curve once the disease has spread widely.
Confirmed Covid-19 fatalities in South Africa will drop below 10 per day by mid-December.
There is no question that the Panda Gompertz curve-fitting approach was successful in predicting future confirmed Covid-19 fatalities accurately for the Western Cape. While the data for the rest of the country is less reliable, similar projections for other provinces and the country as a whole still provides reasonable predictions for confirmed Covid-19 fatalities.
Luister ook: